Introduction
Binary exploitation is all about finding vulnerabilities in compiled binaries (for example, ELF files in linux and exe files in windows) and exploiting them to achieve arbitrary code execution.
Memory Layout of Compiled Programs
We need to understand the memory layout of binaries before diving into the fundamentals of binary exploitation.
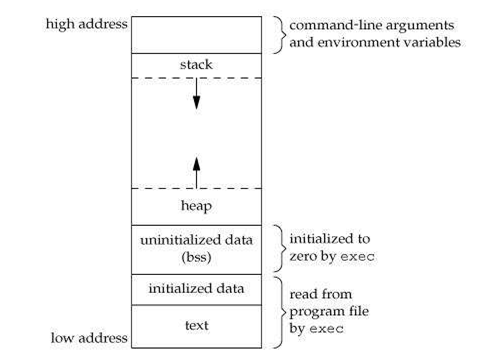
A typical memory representation of a C program consists of the following sections:
- .text
- .data
- .bss
- Stack
- Heap
.bss -> The bss segment stores all uninitialized global and static variables. All such uninitialized variables are initialized to zero at load time, by the loader.
.data -> This section stores all initialized global and static variables.
.text -> text segment (also known as the code segment) contains machine code of the compiled program.
Heap -> Heap is responsible for dynamic memory allocation. Each process gets its own heap. The heap grows from a region of lower memory addresses to a region of higher memory addresses.
1 | // Dynamic memory allocation |
Stack -> This is the place where local variables and function calls are stored. The stack grows from a region of higher memory address to a region of lower memory address.
Subroutines
A subroutine is a sequence of program instructions that perform a specific task. It is just an old programmer speak for either a function or a procedure, i.e., a generic term for a named bit of code.
Call Stack and Stack Frames
A call stack is a stack data structure that stores information about the active subroutines of a program. This kind of stack is also known as a program stack, machine stack, execution stack or run-time stack. Its purpose is to control the way functions call and pass parameters to each other.
Whenever a function is called, a stack frame (activation record) is created which stores the local variables, function arguments and the return address. Stack frames are pushed into the call stack whenever a function is called, and popped from the call stack when the function execution completes. First of all, the function parameters are pushed onto the stack, depending on the calling convention. After that, the return address is pushed onto the stack followed by the saved rbp and local variables.
Registers
A register is a quickly accessible location accessible to a computer’s processor. Registers usually contain a small amount of fast storage, although some registers have special hardware functions. Let’s have a look on some x64 registers.
rbp(Base pointer) -> Points to the bottom of the current stack frame.
rsp(Stack pointer) -> Points to the top of the current stack frame.
rip(Instruction pointer) -> Also known as program counter, it stores the memory address of the next instruction to be executed.
The registers mentioned above are used for special purposes and are sometimes referred to as special purpose registers. Apart from that, there are a few general purpose registers -> rax,rbx, rcx, rdx, rsi, rdi, r8, r9, r10, r11, r12, r13, r14 and r15. There are different sizes for registers.
1 | +-----------------+---------------+---------------+------------+ |
Introduction to Assembly
Assembly is a low-level programming language that is intended to communicate directly with a computer’s hardware. Unlike machine code, assembly is designed to be readable by humans. The syntax of assembly is different for different architectures such as ARM, x86-64, MIPS, RISC-V, etc. Let’s have a look on some basic assembly instructions present in x86-64 architecture.
add
Adds the values specified by the first and the second operand and stores the sum in the first operand. For example:
1 | add rax, rdx |
sub
Subtracts the second operand from the first operand and stores the result in the first operand. For example:
1 | sub rsp, 0x10 |
push
Pushes a value into the stack which grows its size by 8 bytes (in x64) and 4 bytes (in x86). For example:
1 | push rax |
pop
Pops the value stored on the top of the stack into the specified operand which reduces the size of the stack. For example:
1 | pop rax |
jmp
Used to redirect code execution. It causes the execution to jump to the specified address. For example:
1 | jmp 0x40111e |
mov
Copies data from the second operand into the first operand. For example,
1 | mov rax,rdx |
call
Pushes the value of rbp and rip onto the stack, then jumps to the provided address. It is used for calling functions. For example,
1 | call 0x401106 |
square brackets
1 | mov QWORD PTR [rbp-0x8],rdi |
Square brackets are used to dereference a pointer. This is similar to *(rbp-0x8)=rdi, in C/C++.
ret
Pops the return address off the stack and continues execution at that address.
Calling Convention
A calling convention specifies the way arguments are passed to a function.
cdecl
In 32-bit binaries on Linux, function arguments are passed in on the stack in reverse order.
SysV
For 64-bit binaries, the first 6 arguments are passed into rdi, rsi, rdx, rcx, r8 and r9 registers respectively. Remaining arguments are pushed onto the stack in reverse order. The return value is stored in the rax register.
There are other calling conventions as well, such as stdcall, fastcall, etc.
Consider a simple function, which is a part of a C program (assuming SysV calling convention)
1 | size_t func(size_t arg1, size_t arg2){ |
Let’s load the program in gdb and dissassemble func
1 | pwndbg> disassemble func |
The add rax,rdx adds the values and stores the result in the rax register, which is the return value (read the disassembly carefully to find out how the function arguments are passed into rdx and rax respecively).
Buffer Overflow
A buffer overflow occurs when a program attempts to put more data in a buffer than it can hold. The extra data overflows into the adjacent storage and overwrites the data already present there.
 Consider a simple C++ program
1 |
|
1 | gdb ./prog |
1 | pwndbg> x/20gx &overflowme |
1 | b *0x0000000000401196 |
1 | pwndbg> x/20gx &overflowme |
So, we’ve successfully changed the value of the variable modifyMe, which was initially 0xdeadbeef.
Code execution using buffer overflow
Now let’s try some interesting stuff, overwriting variables isn’t fun, right?
1 |
|
Let’s compile this program using g++ prog.cpp -o prog -fno-stack-protector -no-pie and load it in gdb.
pwndbg supports pwnlib‘s cyclic command which can be used to generate a cyclic pattern. Let’s generate a pattern of size 100 bytes.
1 | pwndbg> cyclic 100 |
Let’s set a breakpoint before std::cin to examine the state of the stack before reading the user input.
1 | pwndbg> disassemble main |
Here, 0x7fffffffdda0 is the address of the overflowme buffer. Since, stack pointer points to the top of the current stack frame, we can dump some data around it to view what’s actually present in the stack. Please note that 0x7fffffffdda0 is a stack address, which might be different in different instances of the program due to ASLR (Address Space Layout Randomization).
1 | pwndbg> x/10gx $rsp |
Here, the calling convention is SysV, so the first 6 function arguments will be passed into registers (they will not be pushed onto the stack). In this case, the return address will be pushed into the stack, followed by saved rbp (the push rbp instruction present at the starting of a function), followed by local variables. We also know that the stack grows from higher memory addresses to lower memory addresses.
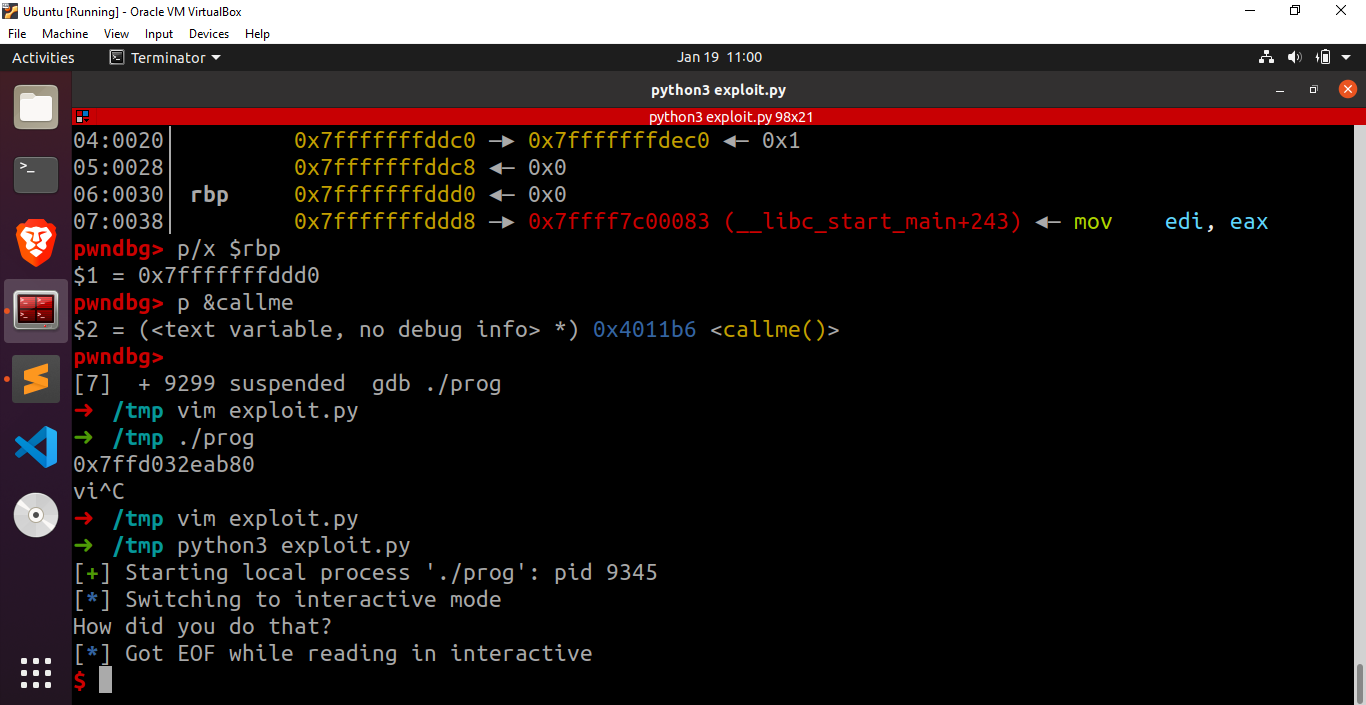
1 | p/x $rbp |
The return address is stored at the location 8 bytes after the pointer stored at rbp i.e at 0x7fffffffddd8. The current return address is 0x00007ffff7c00083 which means that the program will jump to 0x00007ffff7c00083 after executing the current function. We can call any arbitrary function if me manage to overwrite the return address with the address of the function we wanna call.
1 | pwndbg> p &callme |
The address of the function callme is 0x4011b6 which means that we can call the function callme if we somehow write the value 0x4011b6 at the address 0x7fffffffddd8. In this case, sending 56 bytes of junk data followed by the address of callme will do the job. We can use pwntools to write the exploit.
1 |
|
Awesome, we successfully called the function callme by exploiting a buffer overflow.
References
https://youtube.com/playlist?list=PLhixgUqwRTjxglIswKp9mpkfPNfHkzyeN
[https://dhavalkapil.com/blogs/Buffer-Overflow-Exploit/](https://dhavalkapil.com/blogs/Buffer-Overflow-Exploit/)
[https://guyinatuxedo.github.io/](https://guyinatuxedo.github.io/)
[https://ctf101.org/](https://ctf101.org/)